
Turning data into clear decisions
Disconnected reports were consolidated into one dependable view of workload, quality, and team performance.
- Client
- Multi-location services company
- Services
- Data & Reporting
- Published
- January 19, 2026
- Tags
- Reporting, KPI visibility
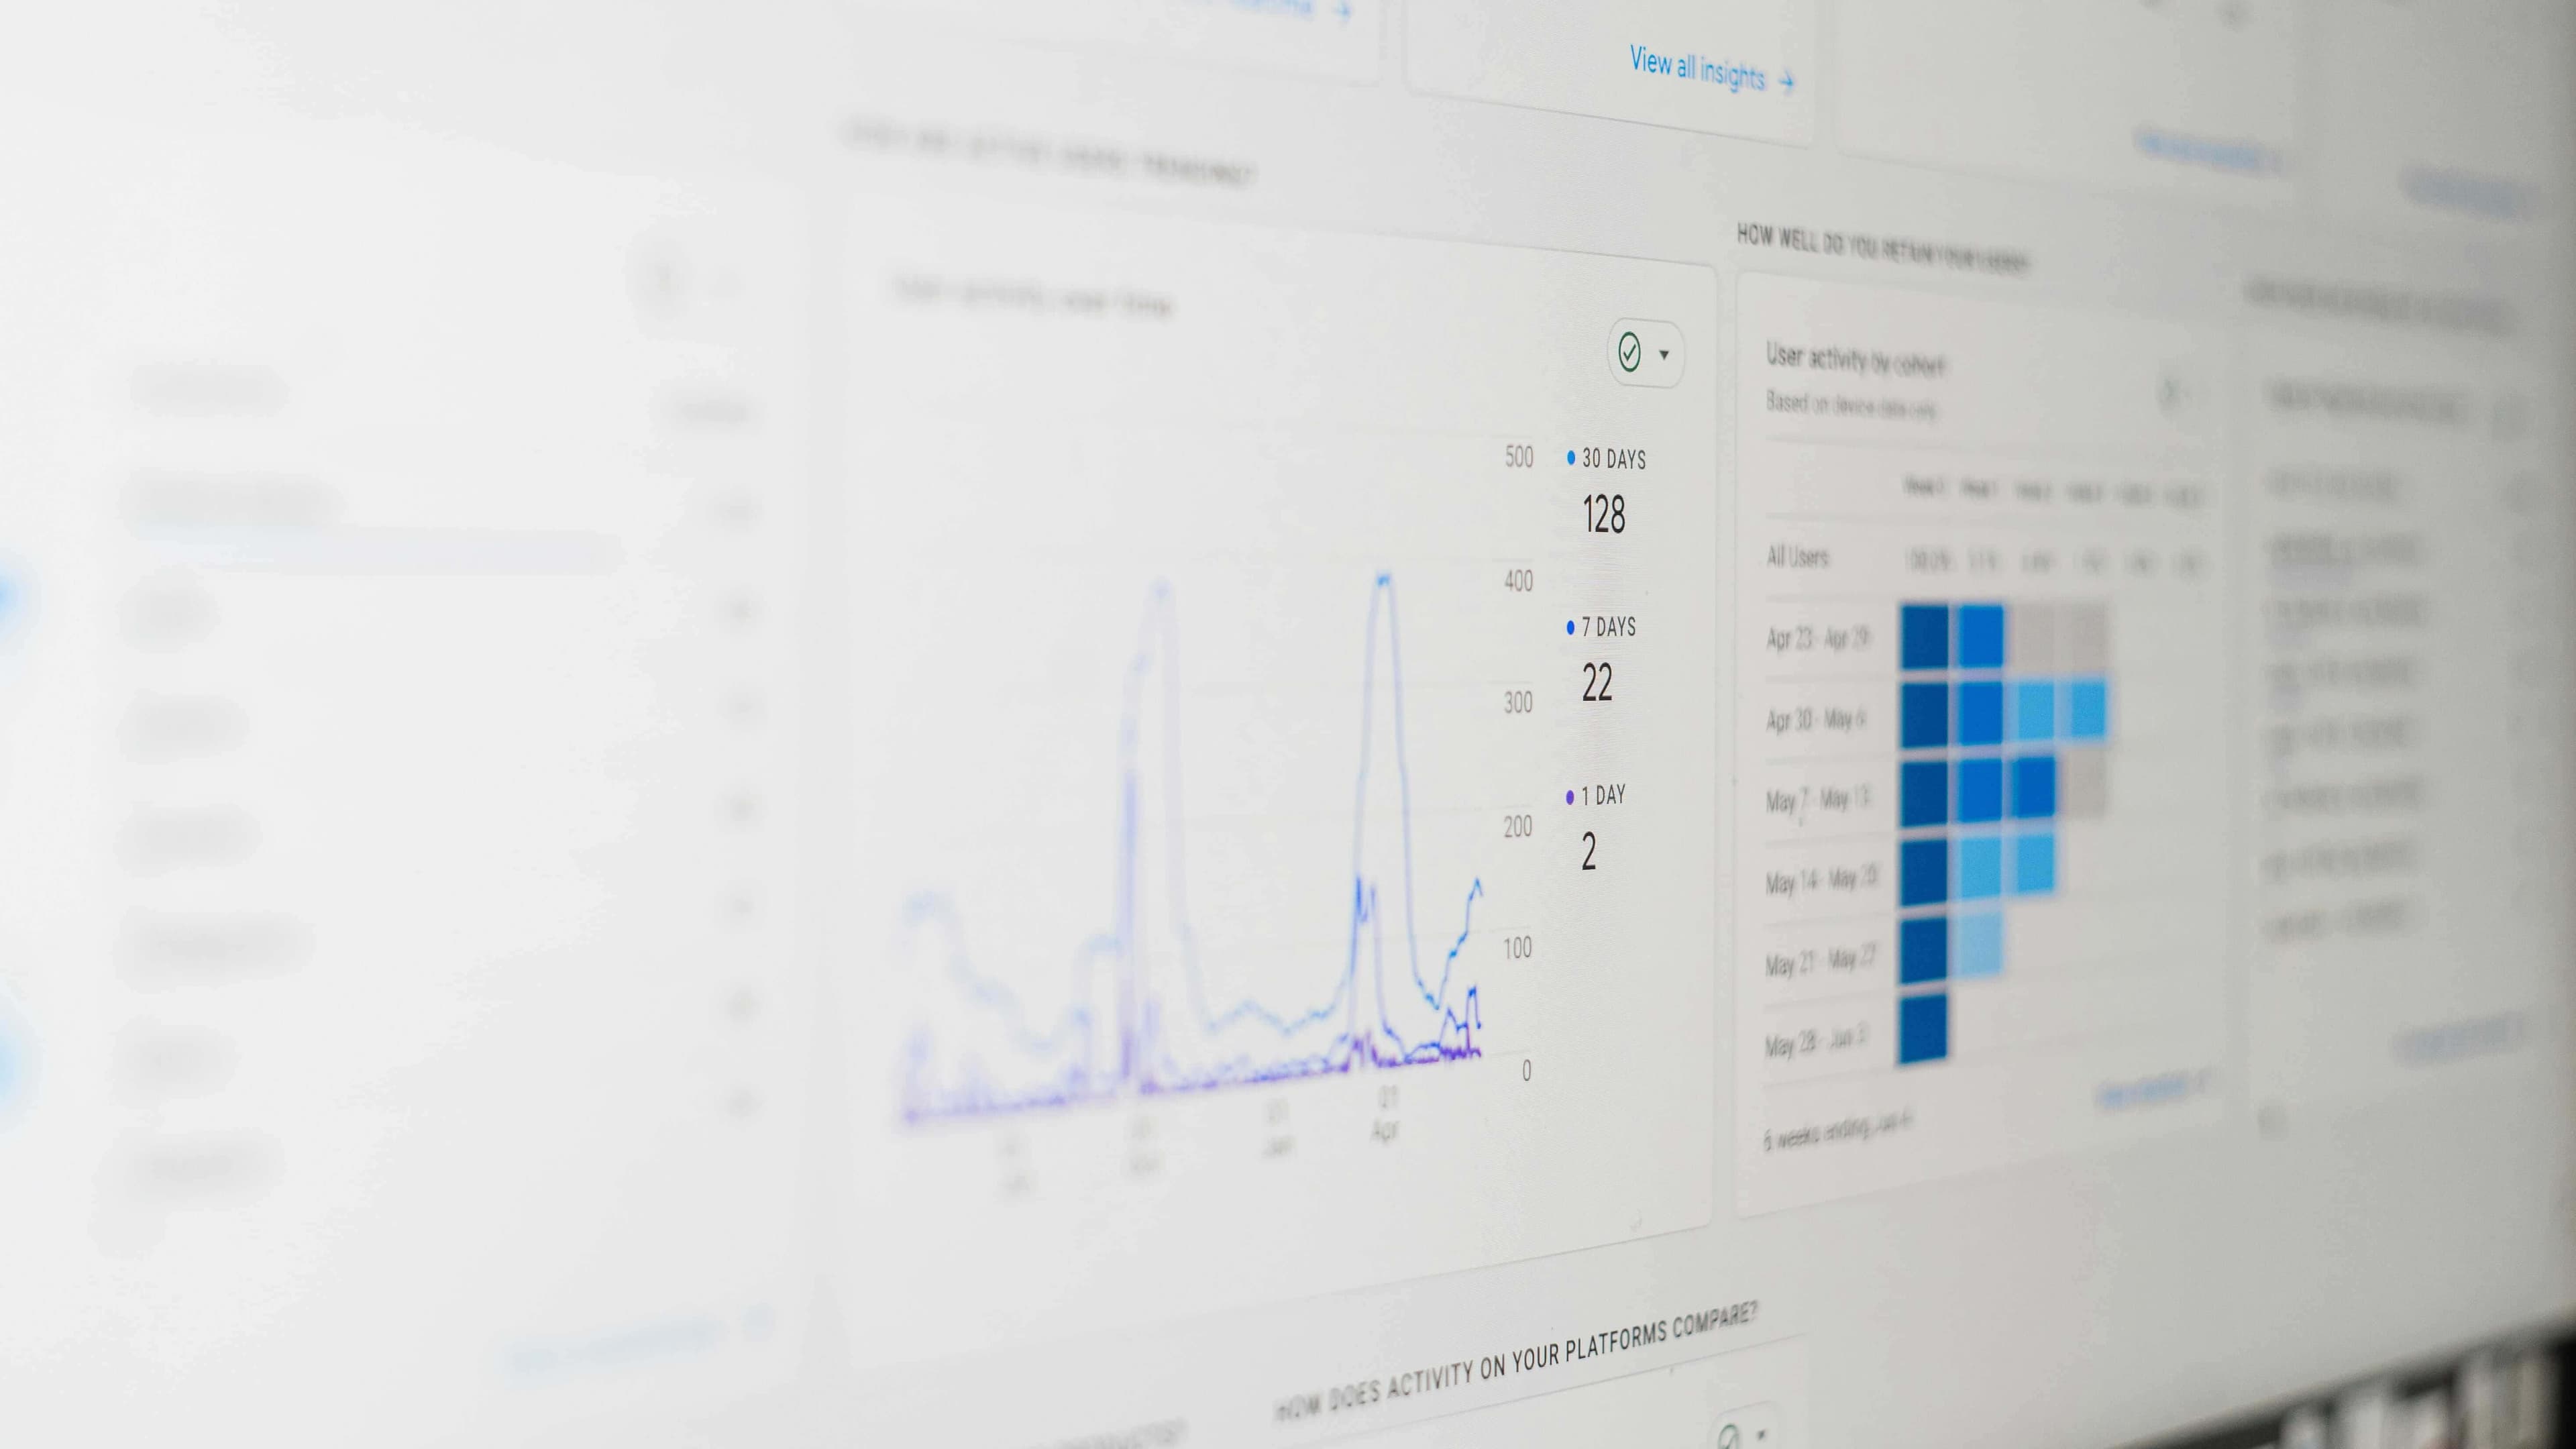
Better visibility and more informed decisions
The narrative
Turning data into clear decisions
The challenge
Each location maintained its own spreadsheets and interpreted key measures differently. Leadership received several versions of workload, service quality, and team performance, often after the period for useful action had passed.
The problem was not a lack of reports. It was the absence of shared definitions, dependable source data, and one reporting cadence that people trusted.
Reporting gaps
- The same measure calculated differently by each location
- Manual consolidation that introduced avoidable errors
- Important exceptions hidden inside large spreadsheets
Our approach
Blih Ops worked with operational leaders to define a small set of measures, the decision each measure supported, and the source fields required to calculate it. We then mapped the existing reports to those definitions and resolved inconsistent categories.
The reporting layer was designed around review, not decoration. It separated current performance, emerging risks, and actions requiring an owner.
A single reporting cadence
- Documented metric definitions and source ownership
- Validation checks before each reporting cycle
- A concise weekly view with exceptions and actions
A dependable report is not the one with the most charts. It is the one that helps the team decide what to do next.
The outcome
Leaders could review workload, quality, and performance from one consistent operating view. Discussions shifted away from reconciling numbers and toward understanding causes, assigning actions, and monitoring progress.
Locations also gained clearer accountability for the quality and timeliness of the data they contributed.